How do you go about working with your stakeholders to deliver value?
The conception of CRISP-DM is 20 years old this year. It was conceived of as a process to formalize data mining (Cross Industry Standard Process for Data Mining) but if we have a look at the diagram below, it really fits for data visualization too!
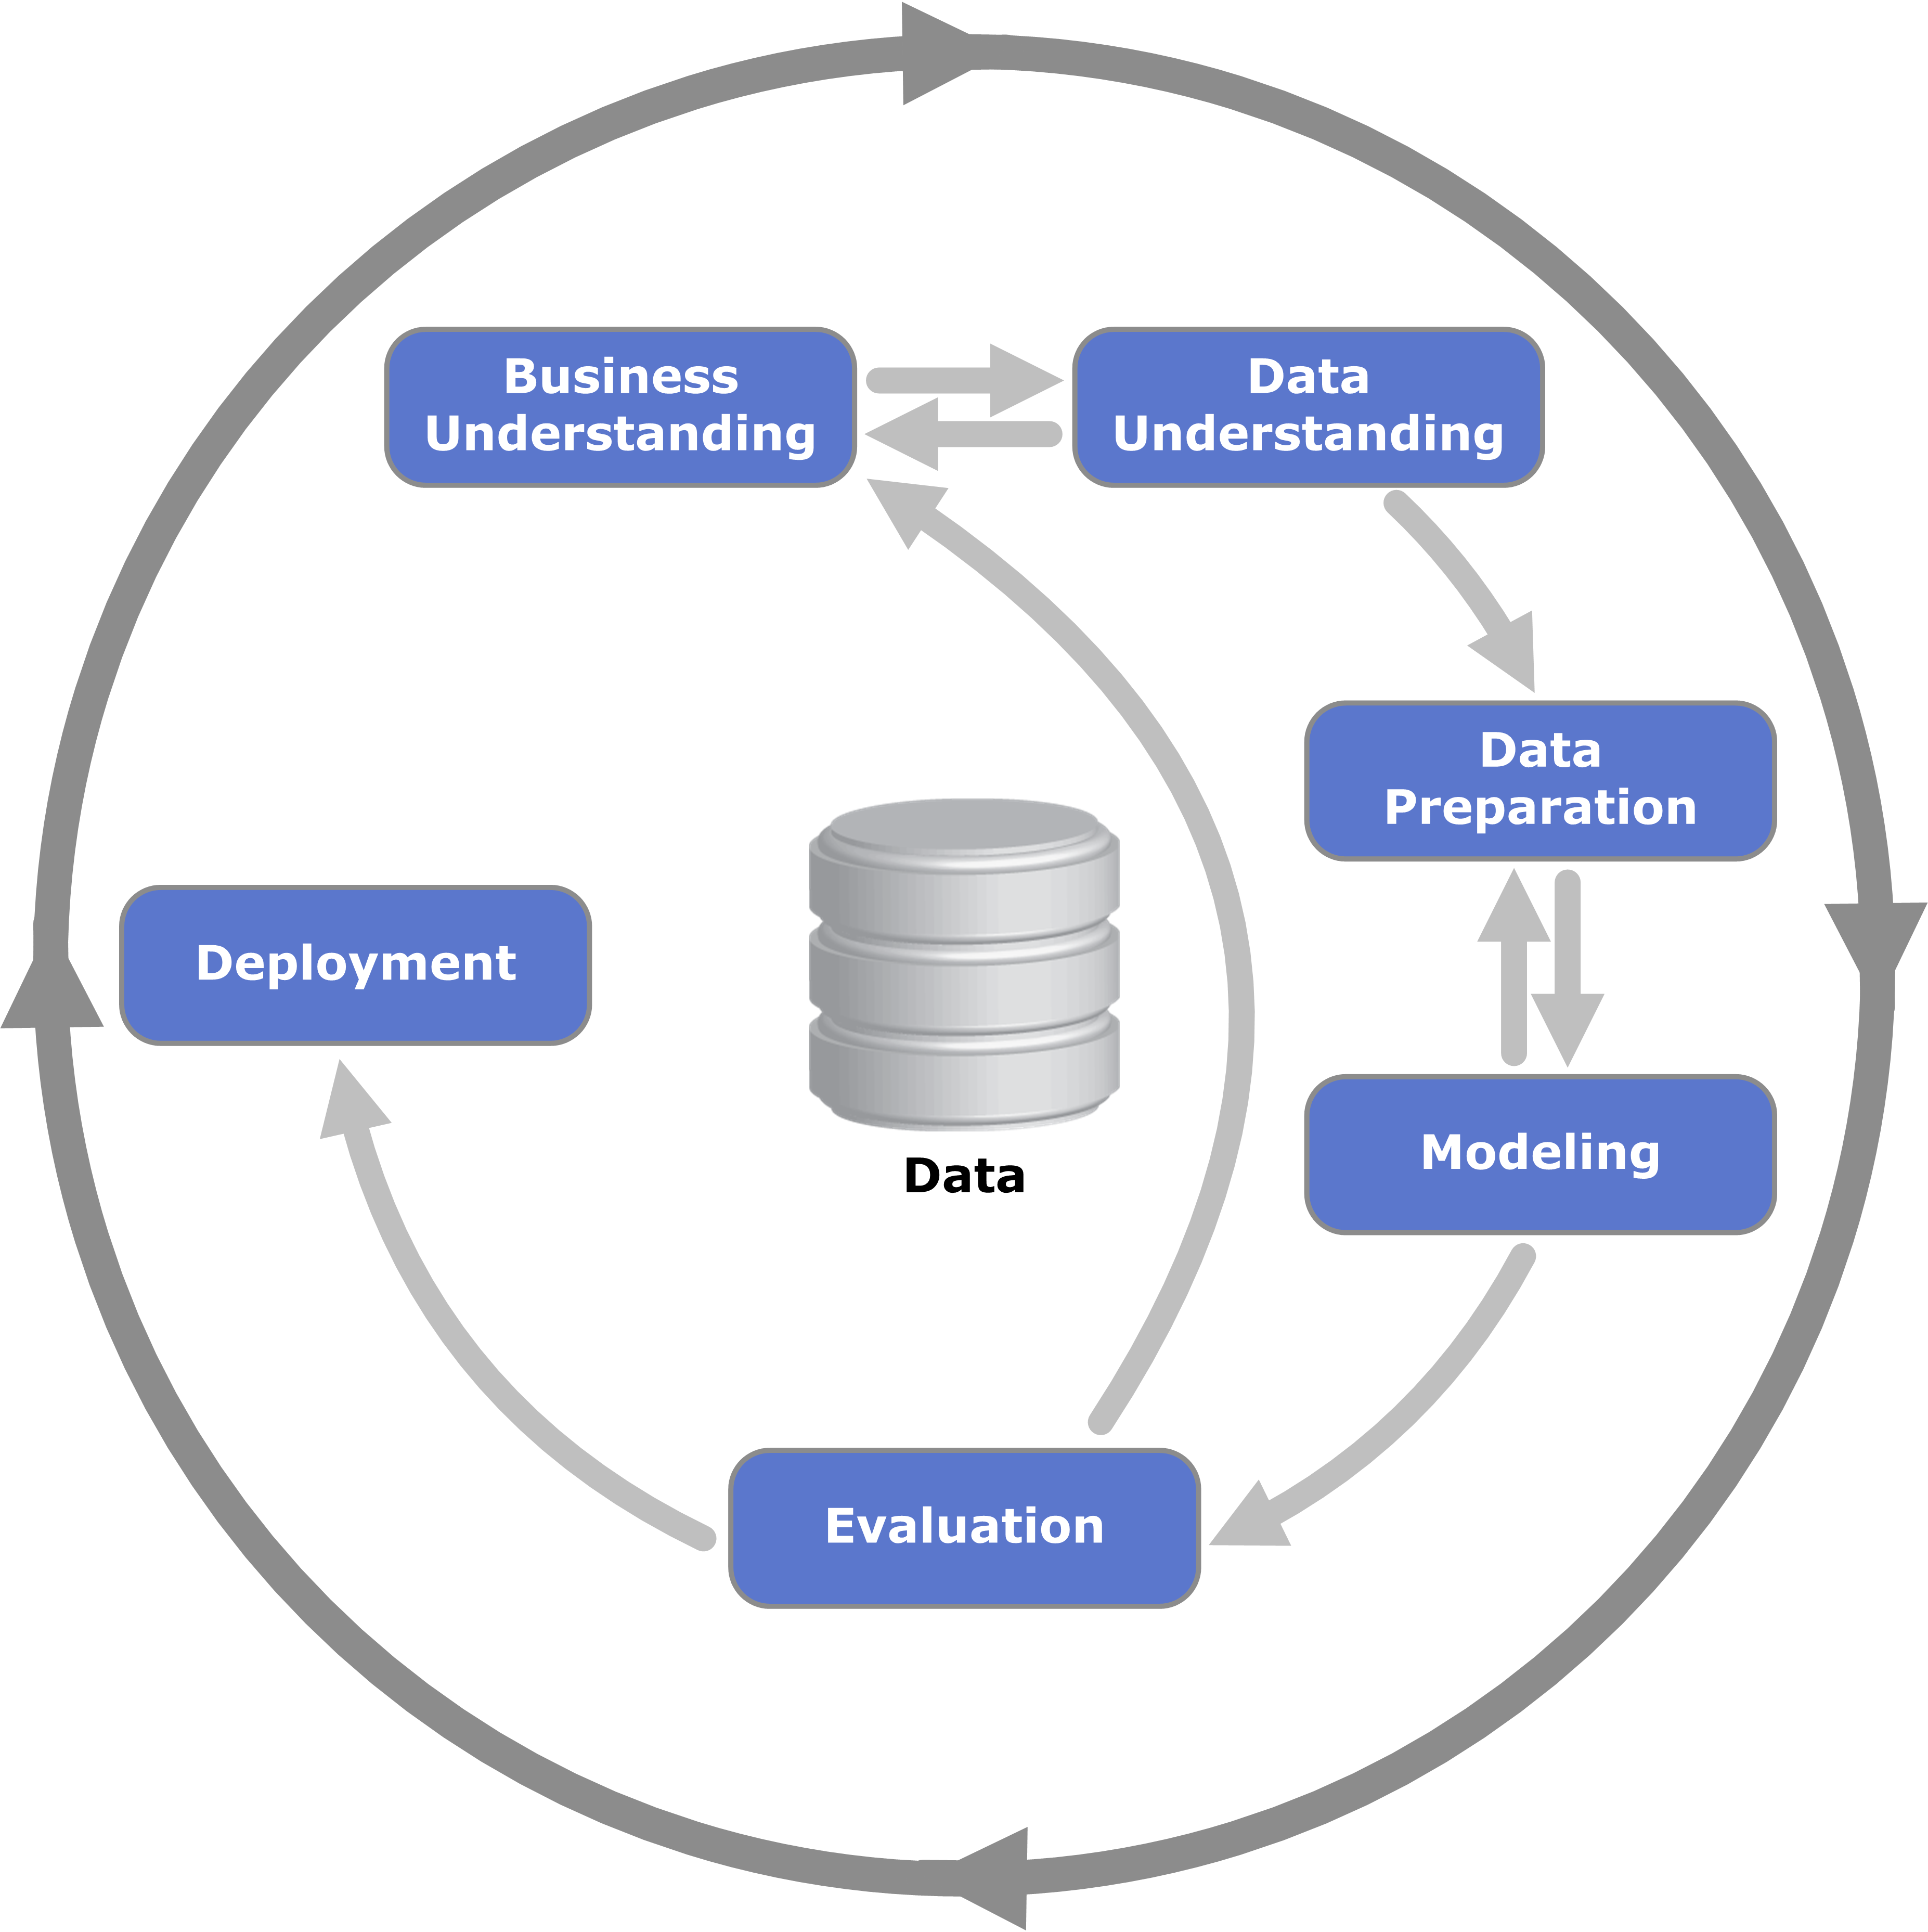
When do we not do all of these steps in a data visualization project? If you are not doing them, why not? I'm OK if you don't, as long as you know why you are not.
It is definitely worth a data visualization practitioners while to review the documentation - much of it freely available online (start with CRISP-DM 1.0 Step-by-step data mining guides)
Stephen Redmond is a Data Visualization professional. He is author of Mastering QlikView, QlikView Server and Publisher and the QlikView for Developer's Cookbook